
Five years from now, you'll probably wish you'd started investing with Stock Advisor
Join over half a million premium members receiving:
- New stock picks each month
- Detailed analysis of companies
- Model portfolios and advanced tools
- Live streaming during market hours
Stock Advisor Returns
+664%
S&P 500 Returns
+152%
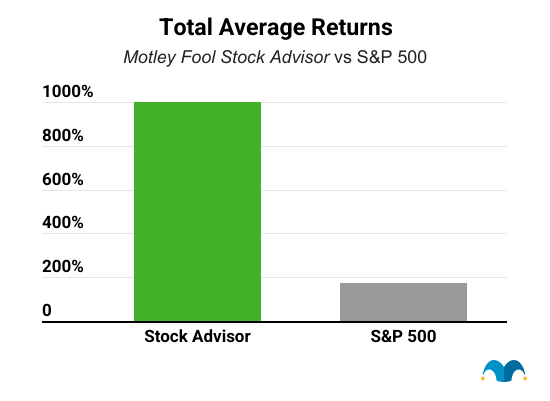
Returns as of 05/08/2024. Stock Advisor launched in February 2002.
Featured Investing News

3 Reasons Crocs Beat Your Favorite Stock This Earnings Season

2 Incredible Growth Stocks to Buy Hand Over Fist

DoorDash Delivered More Than Food and Groceries in the Latest Quarter, but Here's Why Its Stock Sank

3 No-Brainer Vanguard ETFs to Buy in May
Trending News
- The Social Security Cost-of-Living Adjustment (COLA) Forecast for 2025 Was Just Updated, and It Comes With Bad News and Worse News for Retirees
- The Federal Reserve Just Indicated Social Security Could Get a Bigger 2025 Cost-of-Living Adjustment (COLA) Than Expected
- Here's Exactly When Social Security Recipients Can Expect Benefit Cuts, According to the Latest Trustees Report
- 3 Dividend Stocks That Are Coiled Springs for a Lifetime of Passive Income
- Cathie Wood Goes Bargain Hunting: 3 Stocks She Just Bought
- Here's How Much 2025's Estimated Social Security COLA Could Add to the Average Check
- I Used to Think 59 1/2 Was the Best Age to Start Withdrawing From a 401(k). Here's Why I've Changed My Tune.
- 1 Reason I Don't Trust the 4% Rule to Stretch My Money in Retirement, and What I'll Be Doing Instead
- Forget Nvidia: 1 Super Semiconductor Stock to Buy Hand Over Fist, According to Wall Street
- The Most Important Retirement Table You'll Ever See
- 1 Glorious Growth Stock Down 49% to Buy Hand Over Fist, According to Wall Street
- 1 Super Semiconductor Stock Down 42% You'll Wish You'd Bought on the Dip
- This 5.5%-Yielding Dividend Stock Is Going Global to Continue Growing
- 1 Major Difference Between 401(k)s and IRAs That You Should Know, Before You Save Any More for Retirement
- Warren Buffett's $56 Billion Silent Warning to Wall Street May Portend Trouble for Stocks
Popular Topics
Best Stocks to Buy In 2024
Here are 10 stocks that could be excellent additions to your portfolio for the rest of 2024 and for years to come.
Top AI Stocks to Buy
Learn how you can make money investing in the wave of seasoned companies innovating in AI.
How to Invest in OpenAI & ChatGPT
Learn about the new AI chatbot dominating the internet.
6 Steps to Learn How to Buy Stocks
Here's a guide on what you need to do to get started with stock investing.
Top Marijuana Stocks to Invest In
The continued legalization of marijuana means growth for companies in this sector.
Best ETFs to Buy
Exchange-traded funds tend to be less volatile than individual stocks and provide portfolio diversification.
Top 3 S&P 500 Index Funds
Find out which index funds tracking the S&P 500 have the lowest fees and most closely track the market.
5 Top Hydrogen Stocks to Watch
A look at some of the leading hydrogen energy stocks that investors should keep an eye on.
High-Yield Dividend Stocks to Buy Right Now
A list of 20 high-yielding dividend stocks to consider buying now.
Dictionary of Financial Terms
The Motley Fool's list of financial terms. Making the world smarter, happier, and richer.
Investing Solutions Designed To Make Money Over The Long Term
Become a member today
Stock Advisor
Our base-level-membership giving you the foundation of a Foolish portfolio
Our Goal
Help members earn a positive return and build the foundations of a portfolio backed by Motley Fool principles.
Designed For
Individuals who are seeking easy-to-use guidance on investing in more familiar-named companies.
Recommended Minimum Portfolio Size
$5,000 +
Key Features
- Monthly stock recommendations (usually large and mid-cap stocks)
- Portfolio allocation guidance via The Motley Fool's Allocator tool
- On-going coverage of prior recommendations
- Access to Motley Fool Live video stream
Epic Bundle
A bundled membership that combines our four foundational stock-investing services into one
Our Goal
Help members outperform the benchmark by gaining exposure to a wider variety of stocks and investments.
Designed For
Individuals who are regularly adding new money to their brokerage accounts, interested in business, and want to spend more time learning the art of investing.
Recommended Minimum Portfolio Size
$25,000 +
Key Features
- Includes access to Stock Advisor + Rule Breakers + Everlasting Stocks + Real Estate Winners
- Weekly stock recommendations (ranging from small to large-cap stocks)
- Portfolio allocation guidance via The Motley Fool's Allocator tool
- On-going coverage of prior recommendations from all included services
- Access to Motley Fool Live video stream
About The Motley Fool
Our Purpose: To make the world smarter, happier, and richer.
Founded in 1993 by brothers Tom and David Gardner, The Motley Fool helps millions of people attain financial freedom through our website, podcasts, books, newspaper column, radio show, and premium investing services. We believe that investing is empowering, enriching, and fun. We look forward to joining you on your journey to financial independence. Learn More
The Motley Fool Investing Philosophy
Learn How We Invest-
#1 Buy 25+ Companies Over Time
-
#2 Hold Stocks for 5+ Years
-
#3 Add New Savings Regularly
-
#4 Hold Through Market Volatility
-
#5 Let Your Winners Run
-
#6 Target Long-Term Returns